

Weekly Market Snapshot: April 29th
ECONOMY AND POLICY
April 29, 2022
Chief Economist Scott Brown discusses the latest market data.
Real GDP fell at a 1.4% annual rate in the advance estimate for 1Q22, reflecting slower inventory accumulation, lower exports, and a drop in government consumption and investment. Imports, which are a subtraction in the GDP calculation, increased. Real consumer spending rose at a moderate 2.7% annual rate. Business fixed investment rose 9.2%. Net exports subtracted 3.20 percentage points from the headline growth figure, while the change in inventories subtracted 0.84 percentage points. Personal income rose 0.5% in March, while spending rose 1.1% (up 0.2% adjusting for inflation). The PCE Price Index rose 0.9% (+6.6% y/y), up 0.3% (+5.2% y/y) ex-food and energy.
The Employment Cost Index, the preferred measure of labor cost pressures that’s followed closely by Fed policymakers, rose 1.4% over the three months ending in March, up 4.8% from a year ago. The merchandise trade deficit jumped to $125 billion in the advance estimate for March, vs. $106.3 billion in February. Exports rose 7.2% (+18.1% y/y), while imports rose 11.5% (+25.6% y/y), not adjusted for inflation.
Next week: The focus will be on the Federal Open Market Committee (FOMC) policy statement and Chair Powell’s press conference (Wednesday). The FOMC is widely expected to raise the target range for the federal funds rate by 50 basis points (to 0.75% to 1.00%) and announce the start of its balance sheet unwinding (ramping up to $95 billion per month in three months and likely starting at about a third of that). Additionally, the FOMC is expected to signal further rate increases at the next policy meeting (June 14 to 15). We won’t get revised Fed forecasts or a new dot plot at this meeting. The April employment report (Friday) is expected to show a strong gain in nonfarm payrolls (around +450,000 seasonally adjusted ±200,000, and we can expect to add more than a million jobs before seasonal adjustment) and a low unemployment rate (3.5% to 3.6%).
Indices
LastLast WeekYTD return %| DJIA | 33,916.39 | 34,792.76 | -6.66% |
| NASDAQ | 12,871.53 | 13,174.65 | -17.73% |
| S&P 500 | 4,287.50 | 4,393.66 | -10.04% |
| MSCI EAFE | 2,012.60 | 2,126.64 | -13.85% |
| Russell 2000 | 1,917.94 | 1,991.46 | -14.58% |
Consumer Money Rates
Last1 year ago| Prime Rate | 3.50 | 3.25 |
| Fed Funds | 0.32 | 0.07 |
| 30-year mortgage | 5.4 | 3.14 |
Currencies
Last1 year ago| Dollars per British Pound | 1.246 | 1.394 |
| Dollars per Euro | 1.050 | 1.213 |
| Japanese Yen per Dollar | 130.850 | 108.600 |
| Canadian Dollars per Dollar | 1.281 | 1.231 |
| Mexican Peso per Dollar | 20.456 | 19.913 |
Commodities
Last1 year ago| Crude Oil | 105.36 | 63.86 |
| Gold | 1,891.30 | 1,773.90 |
Bond Rates
Last1 month ago| 2-year treasury | 2.62 | 2.33 |
| 10-year treasury | 2.82 | 2.46 |
| 10-year municipal (TEY) | 4.15 | 3.46 |
Treasury Yield Curve – 4/29/2022

As of close of business 4/28/2022
S&P Sector Performance (YTD) – 4/29/2022
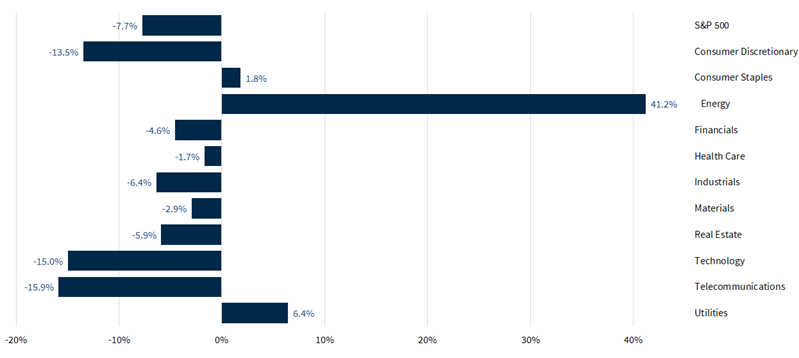
As of close of business 4/28/2022
Economic Calendar
| May 2 | — | ISM Manufacturing Index (April) |
| Mar 3 | — | Factory Orders (March) |
| — | JOLTS data (March) | |
| May 4 | — | ADP Payroll Estimate (April) |
| — | Trade Balance (March) | |
| — | ISM Services Index (April) | |
| — | FOMC Policy Decision | |
| May 5 | — | Cinco de Mayo |
| — | Jobless Claims (week ending April 30) | |
| — | Nonfarm Productivity (1Q22) | |
| May 6 | — | Employment Report (April) |
| May 11 | — | Consumer Price Index (April) |
| May 17 | — | Retail Sales (April) |
| May 25 | — | FOMC Minutes (May 3 to 4) |
| May 30 | — | Memorial Day (markets closed) |
| June 15 | — | FOMC Policy Decision |
All expressions of opinion reflect the judgment of the author and are subject to change. There is no assurance any of the forecasts mentioned will occur or that any trends mentioned will continue in the future. Investing involves risks including the possible loss of capital. Past performance is not a guarantee of future results. International investing is subject to additional risks such as currency fluctuations, different financial accounting standards by country, and possible political and economic risks, which may be greater in emerging markets. While interest on municipal bonds is generally exempt from federal income tax, it may be subject to the federal alternative minimum tax, and state or local taxes. In addition, certain municipal bonds (such as Build America Bonds) are issued without a federal tax exemption, which subjects the related interest income to federal income tax. Municipal bonds may be subject to capital gains taxes if sold or redeemed at a profit. Taxable Equivalent Yield (TEY) assumes a 35% tax rate.The Dow Jones Industrial Average is an unmanaged index of 30 widely held stocks. The NASDAQ Composite Index is an unmanaged index of all common stocks listed on the NASDAQ National Stock Market. The S&P 500 is an unmanaged index of 500 widely held stocks. The MSCI EAFE (Europe, Australia, Far East) index is an unmanaged index that is generally considered representative of the international stock market. The Russell 2000 index is an unmanaged index of small cap securities which generally involve greater risks. An investment cannot be made directly in these indexes. The performance noted does not include fees or charges, which would reduce an investor's returns. U.S. government bonds and treasury bills are guaranteed by the US government and, if held to maturity, offer a fixed rate of return and guaranteed principal value. U.S. government bonds are issued and guaranteed as to the timely payment of principal and interest by the federal government. Treasury bills are certificates reflecting short-term (less than one year) obligations of the U.S. government.Commodities trading is generally considered speculative because of the significant potential for investment loss. Markets for commodities are likely to be volatile and there may be sharp price fluctuations even during periods when prices overall are rising. Specific sector investing can be subject to different and greater risks than more diversified investments. Gross Domestic Product (GDP) is the annual total market value of all final goods and services produced domestically by the U.S. The federal funds rate (“Fed Funds”) is the interest rate at which banks and credit unions lend reserve balances to other depository institutions overnight. The prime rate is the underlying index for most credit cards, home equity loans and lines of credit, auto loans, and personal loans. Material prepared by Raymond James for use by financial advisors. Data source: Bloomberg, as of close of business April 28, 2022.