

The Inflation Outlook: February 16th
February 16, 2021
Chief Economist Scott Brown discusses current economic conditions.
For a variety of reasons, many investors are worried about higher inflation. While we may see reflation (a pickup in prices that were restrained due to the pandemic), a significant increase in underlying inflation appears unlikely.
The Consumer Price Index (CPI) measures the cost of a basket of goods and services over time. The basket represents what a typical consumer would purchase. The CPI is not a true cost-of-living index and personal inflation experiences will vary. The Personal Consumption Expenditures Price Index (PCE Price Index), the Federal Reserve’s chief inflation gauge, uses the same weights as the CPI, but allows the basket to change as consumption patterns change, and tend to rise a few tenths of a percentage point per year more slowly than the CPI. Economists often exclude food and energy prices, but not because they don’t matter. Rather, these prices are volatile and we are interested in the underlying trend.
Money supply measures surged in the early months of the pandemic. However, the relationship between the monetary aggregates (M1, M2, etc.), growth, and inflation broke down in the late 1980s. Money supply growth is not a key factor in the setting of monetary policy. The surge in liquidity during the pandemic helped relieve financial strains, supported growth, and lifted asset prices, but has not boosted consumer price inflation.
The nonpartisan Congressional Budget Office is projecting a $2.3 trillion federal budget deficit for the current fiscal year. That’s 10.3% of GDP (following 14.9% in FY20) and does not include further fiscal support (which may add up to another $1.9 trillion). However, large federal budget deficits DO NOT cause higher inflation. In the 1980s, the U.S. ran deficits on the order of 5% of Gross Domestic Product, while inflation trended lower. Japan currently has a debt-to-GDP ratio of over 235%, yet continues to battle deflation (a general decline in the price level). The U.S. budget deficit rose to 10% of GDP in FY09, with no appreciable increase in inflation.
The pandemic has disrupted supply chains, lengthening supplier delivery times and raising input costs, but these pressures should recede as vaccines are distributed and activity returns to normal. The U.S. trade deficit widened during the pandemic, putting some downward pressure on the exchange rate of the dollar and upward pressure on commodity prices. Note that the dollar surged amid a flight to safety in the early part of the pandemic, then fell back, but the Fed’s Broad Dollar Index is down about 3% since the end of 2019 – not a huge decline. Moreover, while inflation in raw materials has increased, U.S. firms continue to face difficulties in passing higher costs along and there is little inflation in imported finished goods.
With a limited ability to spend during the pandemic, household savings have increased. As the service side on the economy rebounds, strong demand may lead to higher prices for travel and hotels. However, air travel and hotels account for less than 1.5% of the Consumer Price Index and there are plenty of empty hotel rooms and idle airplanes sitting on runways in the desert.
With strong demand for housing and continued supply constraints among builders, home prices have jumped in the pandemic. However, the price of a home does not factor into the CPI. The Bureau of Labor Statistics measures the service that a home provides, not its asset value – and so considers Homeowners’ Equivalent Rent (which accounts for 24% of the overall CPI). Increases in rents have been restrained during the pandemic and there may be a pickup as the economy recovers.
The Fed has a long-term inflation goal of 2% (as measured by the PCE Price Index), but made an important change in its monetary policy framework last year. Following a period with inflation below 2%, the Fed will shoot for a period with inflation moderately above 2%. There is no mathematic formula, but the central bank will be more tolerant of (moderately) higher inflation than it has in the past.
Economists view inflation as being driven primarily by two factors: inflation expectations and the degree of economic slack (measured by the unemployment rate or the output gap, the difference between GDP and its potential). Inflation expectations, as measured through surveys of professional forecasters or through market measures (such as the spread between inflation-adjusted and fixed-rate Treasuries) have remained well-anchored. There should be ample slack in the economy well into next year. As Fed Chair Powell noted in his speech before the Economic Club of New York, accounting for misclassifications and reduction in labor force participation, the unemployment rate would currently be closer to 10% than the 6.3% reported for January.
While the Fed’s massive injection of liquidity into the system is unlikely to fuel a significant increase in consumer price inflation, it may continue to inflate asset prices. Chair Powell continues to downplay these concerns, but there are signs of excess.
Recent Economic Data
The Consumer Price Index rose 0.3% in January (+1.4% y/y), led by a 7.4% rise in gasoline prices (-8.6% y/y). Food prices edged up 0.1% (+3.8% y/y). Ex-food and energy, the CPI was unchanged (+0.031% before rounding, up 1.4% y/y). Apparel rose 2.2% (-2.5% y/y), reflecting seasonal adjustment issues. Used car prices, which had jumped in the early months of the pandemic, fell 0.9%, the third monthly decline (+10.0% y/y).
 Click here to enlarge
Homeowners’ equivalent rent (24% of the overall CPI and 30% of the core CPI) rose 0.1% in each of the last three months, up 2.0% over the last 12 months, vs. +3.3% in the 12 months ending January 2020. Consumer goods ex-food, energy, and used cars rose 0.3% in January, up 0.5% y/y (vs. +0.0% for the 12 months ending January 2020). Non-energy services were unchanged (+1.3% y/y).
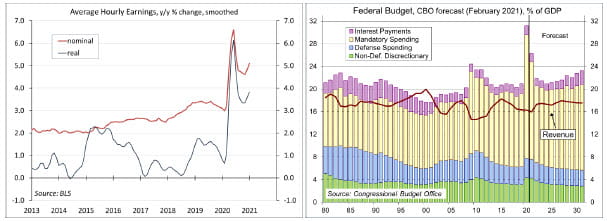
Real average hourly earnings were flat in January, up 4.0% y/y. However, these figures are distorted by compositional changes (massive job losses in lower paying industries).
 Click here to enlarge
The non-partisan Congressional Budget Office released its latest outlook (based on current law – that is, no further fiscal support). The deficit is on track for $2.3 trillion (10.3% of GDP) deficit this year, dropping back to
$905 billion (3.6% of GDP) in FY24. Interest payments remain low relative to GDP (much less than in the 1980s).
Gauging the Recovery
The number of new daily COVID-19 cases has continued to decline sharply, but from a highly elevated level in early January. The drop has led to a relaxation in social distancing directives, which should help the economy into 2Q21. The number of U.S. deaths from the coronavirus is nearing 500,000.
 Click here to enlarge
The New York Fed’s Weekly Economic Index fell to -2.25% for the week ending February 6, down from -1.87% a week earlier (revised from -2.27%) and a low of -11.45% at the end of April. The WEI is scaled to four- quarter GDP growth (for example, if the WEI reads -2% and the current level of the WEI persists for an entire quarter, we would expect, on average, GDP that quarter to be 2% lower than a year previously).
Jobless claims fell to 793,000 in the week ending February 6 (813,145 before seasonal adjustment), still very high by historical standards. The previous week was revised to 812,000 (from 779,000).
 Click here to enlarge
The University of Michigan’s Consumer Sentiment Index fell to 76.2 in the mid-month assessment for February (the survey covered January 27 to February 10), vs. 79.0 in January and 80.7 in December. The report noted “the entire loss was concentrated in the Expectation Index and among households with incomes below $75,000.” Surprisingly, “consumers, despite the expected passage of a massive stimulus bill, viewed prospects for the national economy less favorably in early February than last month.”
The opinions offered by Dr. Brown are provided as of the date above and subject to change. For more information about this report – to discuss how this outlook may affect your personal situation and/or to learn how this insight may be incorporated into your investment strategy – please contact your financial advisor or use the convenient Office Locator to find our office(s) nearest you today.
This material is being provided for informational purposes only. Any information should not be deemed a recommendation to buy, hold or sell any security. Certain information has been obtained from third-party sources we consider reliable, but we do not guarantee that such information is accurate or complete. This report is not a complete description of the securities, markets, or developments referred to in this material and does not include all available data necessary for making an investment decision. Prior to making an investment decision, please consult with your financial advisor about your individual situation. Investing involves risk and you may incur a profit or loss regardless of strategy selected. There is no guarantee that the statements, opinions or forecasts provided herein will prove to be correct.