

The Fiscal Policy Outlook
January 22, 2021
Chief Economist Scott Brown discusses current economic conditions.
As expected, the new administration has hit the ground running. In his first two days in office, President Biden issued executive orders which rescinded a number of previous directives or were aimed at ending the pandemic and easing the pandemic’s economic impact. For investors, the bigger issue seems to be the prospects for further fiscal support. Biden has proposed a $1.9 trillion package. That’s on top of the $900 billion passed at the end of last year. Passage of a bill this size will be an uphill battle, as the Democrat’s advantage in the House and Senate are as narrow as they can get. Still, it’s worth taking a step back and looking at fiscal policy over the last decade and what lies ahead after the pandemic has passed.
Monetary policy refers (mostly) to the setting of interest rates (we can also throw in asset purchases) to achieve the Fed’s goals of price stability and maximum sustainable employment. More on this in a minute. Fiscal policy refers to taxes and government spending. The broad consensus among economists is that balancing growth should be largely left to monetary policy, except in recessions, when fiscal policy typically becomes more effective than monetary policy.
Federal budget deficits can reflect developments in the economy or active policy changes, and it’s often difficult to isolate these two effects. For example, tax receipts fall in periods of economic weakness, widening the deficit. When we talk about active fiscal policy, we’re talking about a wider deficit beyond any direct recessionary impact. The aftermath of the 2008 financial crisis had a significant short-term impact on the deficit, as tax revenues sank and recession-related spending (unemployment insurance benefits, food stamps, etc.) increased. The deficit in FY09 hit $1.4 trillion, nearly 10% of nominal GDP. By FY15, the deficit had fallen to $439 billion, or 2.4% of GDP. In response to the pandemic, the deficit exceeded $3.1 trillion, about 16% of GDP in FY20. As with the large deficit following the financial crisis, this latest surge in the deficit in not worth losing sleep over. The deficit will fall as the pandemic fades. After the pandemic, lawmakers should work to get the federal budget on a sustainable path – but there’s no need to rush.
It’s interesting to note what happened to fiscal policy between the financial crisis and the pandemic. Fiscal tightening, at the federal, state, and local level, subtracted 0.6 percentage point from annual GDP growth from 2010-2016. In contrast, spurred by tax cuts, increased federal government spending, and a recovery in state and local government finances, fiscal expansion added more than 0.7 percentage point to GDP growth from 2016-2019. The federal budget deficit rose to $984 billion (4.6% of GDP) in FY19 and was on track to exceed $1 trillion (nearing 5% of GDP) in FY20. Real GDP rose at a 2.6% annual rate from 4Q12 to 4Q16 (the last four years of the Obama administration), vs. 2.5% from 4Q16-4Q19 (the first three years of the Trump administration). In Obama’s second term, there was still plenty of ground to make up from the financial crisis (that is, a lot of slack remaining), and there was less slack in the Trump years, but fiscal policy was a headwind in Obama’s second term and a significant tailwind in the (pre-pandemic) Trump years. Note that I use the president’s name for these periods as a convenience. Presidents have little control of the economy in the short term and fiscal policy legislation is determined by Congress.
Simply put, expansionary fiscal policy (an increased deficit) is expansionary. Increased spending adds to GDP growth. Cutting taxes adds to GDP growth. Contractionary fiscal policy (austerity) is contractionary. Raising taxes or cutting spending slows GDP growth.
If Biden somehow gets his $1.9 trillion plan through Congress, the fiscal support this year will exceed that of 2020. It’s important to note that all fiscal stimulus isn’t equal. Multipliers vary and are sure to be smaller than in 2020, when the pandemic impact on growth was a lot greater. Economists note that sending checks to people is not effective stimulus. Checks are much more likely to be saved or used to pay down debt than to be spent (yet, lawmakers loves to send checks out during every downturn). Extending unemployment benefits and giving money to states provide a much better bang for the buck. Still, the amount of effective stimulus in 2021 would likely exceed the output gap (the difference between GDP and potential GDP).
Much of the fiscal package includes additional spending to fight the pandemic, and if vaccines are distributed more quickly, the economy would rebound sooner than expected. That could lead to higher inflation, but some reflation in prices (that were restrained during the pandemic) was already anticipated, and the Fed has signaled a tolerance for a period of inflation above the 2% target. The Fed typically sets monetary policy with an eye on where the economy is likely to be in a year, but officials have signaled a willingness to let this run. Short-term interest rates will remain near 0%. While there has already been some discussion of reducing the monthly pace of asset purchases (currently $120 billion), Chair Powell has indicated that won’t happen until we see “significant” improvement in labor market conditions – and that’s still far away.
Gauging the Recovery
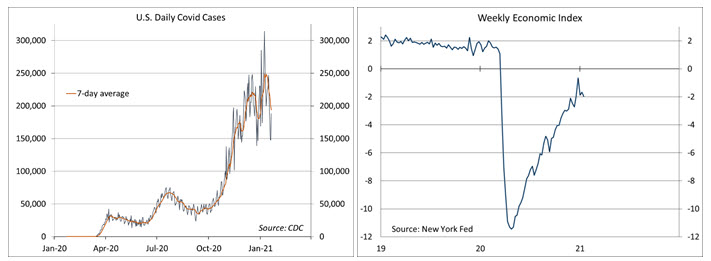
The number of new daily COVID-19 cases has declined from recent highs, but remain elevated. Increased social distancing, whether state mandated or voluntary self-preservation, should slow the pace (and the economy). The number of U.S. deaths from the coronavirus now exceeds 400,000.
 Click here to enlarge
The New York Fed’s Weekly Economic Index fell to -1.98% for the week ending January 16, down from -1.67% a week earlier (revised from -1.70%) and a low of -11.45% at the end of April. The WEI is scaled to four- quarter GDP growth (for example, if the WEI reads -2% and the current level of the WEI persists for an entire quarter, we would expect, on average, GDP that quarter to be 2% lower than a year previously).
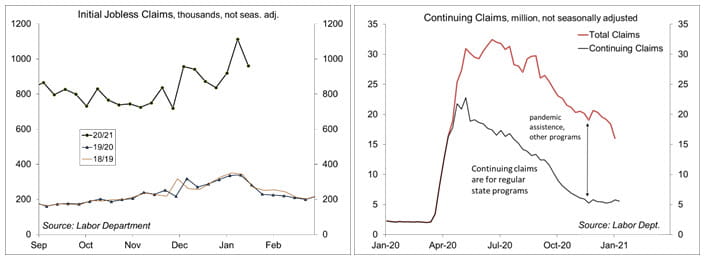
Jobless claims fell to 900,000 in the week ending January 16 (960,668 before seasonal adjustment). The surge in the first two weeks of the year is likely the result of people re-filing after some pandemic-assistance (temporarily) expired at the end of last year.
 Click here to enlarge
The University of Michigan’s Consumer Sentiment Index edged down to 79.2 in the mid-month assessment for January (the survey covered January 2-13, vs. 80.7 in December and 76.9 in November. The report noted a “trivial” decline in early January “despite the horrendous rise in covid-19 deaths, the insurrection, and the impeachment of Trump.”
The opinions offered by Dr. Brown are provided as of the date above and subject to change. For more information about this report – to discuss how this outlook may affect your personal situation and/or to learn how this insight may be incorporated into your investment strategy – please contact your financial advisor or use the convenient Office Locator to find our office(s) nearest you today.
This material is being provided for informational purposes only. Any information should not be deemed a recommendation to buy, hold or sell any security. Certain information has been obtained from third-party sources we consider reliable, but we do not guarantee that such information is accurate or complete. This report is not a complete description of the securities, markets, or developments referred to in this material and does not include all available data necessary for making an investment decision. Prior to making an investment decision, please consult with your financial advisor about your individual situation. Investing involves risk and you may incur a profit or loss regardless of strategy selected. There is no guarantee that the statements, opinions or forecasts provided herein will prove to be correct.