

The Fed Still Has a Tough Road Ahead
ECONOMY & POLICY
May 27, 2022
Chief Economist Eugenio J. Alemán discusses current economic conditions.
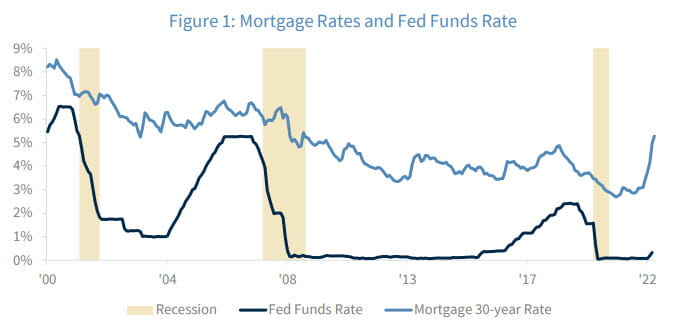
Data released this week and last tend to confirm our suspicions that the housing market has peaked, and is going to continue to slow down. The Federal Reserve (Fed) campaign to increase interest rates to slow down economic activity has hit its first intended target—the housing market. And, while the Fed was late out of the gate when inflation started to rear its ugly head, the response from mortgage interest rates has been eye-popping. Normally, monetary policy takes time to affect the economy; in general, monetary policy lag time is between six to twelve months. However, this time around, the speed at which mortgage rates have increased and have affected the housing market has been impressive.
Click here to enlarge
Still, home prices are likely to plateau in the coming quarters, which will help take some pressure off inflation. What else is next in line for the Fed and the economy? And remember that we are still in the camp of no recession for a year to a year and a half. That is, we are envisaging a slowdown of the consumer, not a contraction, which would generate a recession.
That is, we expect consumer demand to slow down. It has been growing at a very fast pace due to excess cash balances accumulated during the Covid-19 pandemic as Americans received transfers from the government but did not have many places to spend that cash. During the Covid-19 pandemic, our behavior was akin to what workers do when working on a petroleum platform in the middle of the North Sea: they just drink beer (wine in my case) and save a ton of money for when they are back on dry land! Americans have been on dry land for a while already and consumer demand has been strong as a result.
Looking at consumer demand by sector, the service economy was the most affected sector during the pandemic. Consumer demand for services was down 18.9% at the trough of the pandemic recession while overall household consumption expenditures for services were down 22.6%, with both troughs occurring in April of 2020, year-over-year. Meanwhile, consumption of goods was down ‘only’ by 10.8%, also in April of 2020. However, consumption of goods started to recover in May of 2020 while services did not start to grow until March of 2021 on a year-earlier basis. In fact, the consumption of goods was above pre-COVID recession levels in June of 2020 while the consumption of services hit this mark in March of this year.

Click here to enlarge
Thus, our expectation is that personal consumption expenditures in goods will continue to slow down while personal consumption expenditures of services will continue to recover. This weakening of goods consumption will also help the Fed in reducing pricing pressures built up over the last year or so. The graphs below show the evolution of goods versus services prices over the years, with goods prices accelerating more than services prices during the last year.

Click here to enlarge
Although goods consumption is about 40% (consumption of services represent 60%) of total personal consumption expenditures, the increase in the price of those goods has had an outsized impact on overall inflation. Thus, a slowdown in goods consumption will be welcome news for the Fed as it tries to put a cap on further price increases.
Consumption of used and new autos and light trucks surged in 2020 and 2021 but have come down handsomely this year. This pushed prices for these goods higher starting in 2020. Prices for used autos and used light trucks surged starting in 2020 and have been followed by an increase in the price of new autos and new trucks. However, those price pressures have started to recede or at least temper a bit.

Click here to enlarge
Food and Energy:
Some of the most damaging components of the current inflation level are something near and dear to American families. And both are very difficult to live without. That is, we cannot live without food and gasoline. Although consumers were able to reduce gasoline consumption and miles driven during the pandemic, they are back on the road, be it for work or for leisure. Thus, this year’s strong increase in the price of gasoline has put a lot of pressure on individuals’ pocketbooks.

Click here to enlarge
Although gasoline prices declined in April of this year, they have shot up again in May so this component of price pressure will continue to give the Fed a headache.
Furthermore, food prices also rose considerably starting in 2020 and have accelerated this year. However, consumption of food and beverages has slowed down considerably, which should limit further increases in prices. The price acceleration has been, partly, a consequence of the Ukraine-Russia war so it will remain a concern for the Fed so long as that conflict continues.

Click here to enlarge
Thus, monetary policy from the Fed will remain on a tightening path until September of this year when we believe the Fed will revise their views on further policy tightening in light of incoming information on inflation.
Summary of the week:
New Home Sales: The decrease in new home sales is more supporting evidence of the housing slowdown. Home prices are probably going to plateau in the coming months. April was the fourth straight monthly decline in new home sales, the longest streak since October of 2010. The strong increase in interest rates is taking its toll on the housing market. We saw some evidence last week with the release of housing starts, building permits, and existing home sales. This week, new home sales added to the supporting evidence that the housing boom the US economy has experienced during the last couple of years is in the rearview mirror. The only region that showed a year-over-year increase in new home sales was the Northeast, up 17.1%. However, the Midwest declined 25.5% while new home sales declined 12.4% in the West and the South saw the largest year-over-year decline with a drop of 36.6%.
Durable Goods: Overall, we saw a decent durable goods orders report even though the 0.4% increase in April was below the 0.6% markets were expecting. Although the durable goods orders report came in a bit lower than expectations the report was strong and points to a continued expansion in manufacturing activity in the US. Perhaps the most notable data point was the weakness in motor vehicles & parts, which declined 0.2% and was the third decline in four months. However, that decline came after a strong, 4.8% increase in March of this year. Durable goods orders of motor vehicles & parts were 8.4% higher than a year earlier.
1Q GDP (2nd Estimate): The revision to Q1 GDP showed a weaker investment environment for the US economy in the first quarter than originally estimated but stronger consumer demand. Although the GDP release showed a slight deterioration in the topline number (GDP), personal consumption expenditures were stronger and final sales to domestic purchasers were a bit stronger in the revision. Gross private investment was lower than originally estimated, led by downward revisions to structures and residential investment. On the other hand, lower inventory accumulation also put further downward pressure on the top line number.
Personal Consumption Expenditures: According to the Bureau of Economic Analysis (BEA), nominal personal income increased 0.4% in April while disposable personal income (DPI, income after taxes and transfers) increased 0.3%. Personal consumption expenditure (PCE), on the other hand, increased 0.9%. The picture adjusted for inflation wasn’t as rosy as the nominal numbers. Adjusted for inflation, disposable personal income was almost flat in April. In fact, the BEA reported that Real DPI increased less than 0.1%. Meanwhile, the consumption side of the equation was better than the income side, something that was anticipated last week through the release of the retail sales report. The saving rate declined to 4.4% of DPI compared to 5.0% in March. Clearly, consumers have continued to dig into savings to keep consumption strong. The saving rate declined to 4.4% of disposable personal income compared to a 5.0% reading in March. This strength in personal consumption expenditures cannot continue much longer. In the coming months and quarters, something has to give; either consumption slows down to match income gains and/or inflation continues to slow down and push real incomes higher.
Consumer Sentiment: The final May reading of the Michigan Consumer Sentiment index was lower than the estimate released earlier this month, from 59.1 to 58.4 (vs. 59.1 expected), the lowest level since 2011. This marks a 10.4% decline month-over-month, and a 29.6% decline since May 2021. While inflationary concerns drove consumer sentiment lower, expectations of inflation for the next year came in a bit lower, from 5.4% to 5.3%, the very first decline in inflation expectations since June of 2021. This is a potential indicator that consumers are becoming less pessimistic about the future of personal finances. Longer-term, these expectations remained unchanged. The main drivers behind the decline were the increasingly tougher home-buying conditions due to higher mortgage rates and home prices, as well as higher prices for durable goods. Both housing and durables prices are starting to plateau, and therefore these should have less of a negative impact going forward.
Economic Forecasts:

Click here to enlarge
Economic and market conditions are subject to change.
Opinions are those of Investment Strategy and not necessarily those Raymond James and are subject to change without notice the information has been obtained from sources considered to be reliable, but we do not guarantee that the foregoing material is accurate or complete. There is no assurance any of the trends mentioned will continue or forecasts will occur last performance may not be indicative of future results.
Consumer Price Index is a measure of inflation compiled by the US Bureau of Labor Studies. Currencies investing are generally considered speculative because of the significant potential for investment loss. Their markets are likely to be volatile and there may be sharp price fluctuations even during periods when prices overall are rising.
Consumer Sentiment is a consumer confidence index published monthly by the University of Michigan. The index is normalized to have a value of 100 in the first quarter of 1966. Each month at least 500 telephone interviews are conducted of a contiguous United States sample.
The producer price index is a price index that measures the average changes in prices received by domestic producers for their output. Its importance is being undermined by the steady decline in manufactured goods as a share of spending.
Industrial production: Industrial and production engineering is a measure of output of the industrial sector of the economy. The industrial sector includes manufacturing, mining, and utilities.
Personal Consumption Expenditures Price Index (PCE): The PCE is a measure of the prices that people living in the United States, or those buying on their behalf, pay for goods and services. The change in the PCE price index is known for capturing inflation (or deflation) across a wide range of consumer expenses and reflecting changes in consumer behavior.
Source: FactSet, data as of 5/27/2022